
Knapp-Track estimates that same-store sales for the casual-dining category fell 1.7 percent for March, versus the same month last year, when the sector’s comparable-restaurant sales grew 2.3 percent—the second-highest monthly result for 2006.
Same-store guest counts fell by an estimated 3.6 percent for March, more than twice the casual-dining sector’s 1.5-percent traffic decline for March 2006.
A final accounting for the March estimates, which are based on weekly data, will depend in large part on shifts in results for individual chains, based on the specific weeks that are included in their accounting month.
All five weeks of March 2007 had negative same-store sales and guest counts. The spread between the best week of the five and the worst was 3 percentage points, with the best week being the last week. The worst week was the third week, because of ice storms in the East.
I estimate that March’s cold, icy weather contributed negative 0.5 percentage points to the same-store decline.
There was some negative impact to spending in March because of increased costs for gasoline, which rose 32.4 cents per gallon in March, and for home heating, because of the cold weather and the spike in heating fuel.
Because of the shift in Easter this year to one week earlier than the year before, data for April will be hard to explain in terms of trend lines. The test of a trend will come in May.
By comparison with the casual-dining sector’s estimated March result, the weighted average same-store sales performance for the retail industry overall was a gain of 6.2 percent for the month, as measured by Bear Stearns’ retail analysts. The pattern of the period from April 2003 through March 2007 is that Bear Stearns’ retail same-store results have outperformed the casual-dining sector, with the exception of November 2004, January 2005, April 2005, May 2005, January 2006 and March 2006.
In March 2007, department stores led the retail sector in comparable-store sales with a gain of 9.4 percent, followed by gains for softlines at 8.6 percent, drug stores at 6.9 percent, discounters at 5.3 percent, and home furnishings, whose same-store sales fell 13.5 percent. Junior apparel led in the softlines merchandise category with a comparable-store sales gain of 10.4 percent, followed by apparel stores at 9.4 percent. Off-price apparel was last at 6.4 percent.
Higher-demographic department stores as well as apparel stores, drug stores and higher-demographic discounters were the best retail performers in March 2007.
The very high results for March were due to an earlier Easter. April sales suffered accordingly, I have estimated. You have to look at combined March and April sales data to get a sense of the true retail trend.
More-affluent customers are emotionally but not particularly fiscally affected by gasoline, food and prescription drug price increases. Higher-demographic retail stores have been comparable-store sales leaders. In March, for example, Nordstrom, a chain store with a higher-income demographic, sported a 15-percent gain. Another higher-income department store that did well was Neiman Marcus at 10.2 percent. Saks Fifth Avenue had a sales gain of 10.1 percent for the month. Target, a relatively high-demographic discount chain, had a same-store sales gain of 12 percent, while Costco had a gain of 6 percent. Wal-Mart, excluding Sam’s Clubs, was up a comparatively scant 3.4 percent. Sam’s Clubs’ same-store sales rose 7.4 percent.
Value propositions for the majority of concepts will continue to be very important as general inflation, energy cost increases, education costs, and medical and drug cost increases put substantial pressure on households earning under $50,000.
The basic economy is slowing. The Manufacturing Index, as measured by the Institute for Supply Management, was 50.9 in March 2007, down 1.4 index points from 52.3 in February 2007. An index above 50.0 indicates an expansion of manufacturing activity. The average Manufacturing Index for the past 12 months was 52.7. The basic good news in manufacturing was that export orders still were expanding, with a March index number of 55.5, up 1.5 index points from February. Export orders had expanded for 52 months.
The Non-Manufacturing Business Activity Index of the Institute for Supply Management fell 1.9 index points to 52.4 in March 2007, down from 54.3 in February 2007. Services had been expanding since March 2003, a consecutive increase of 48 months. In March the average Non-Manufacturing Index for the prior 12 months was 56.0.
The good news was that from March 2006 through March 2007, the number of payroll jobs had increased by a revised 1.96 million jobs, or an increase of 1.45 percent.
There were sharp differences in unemployment rates by race. The unemployment rate in March for whites was 3.8 percent. For Hispanics it was 5.1 percent, and for African-Americans the rate was 8.3 percent. The white unemployment rate was down 0.2 percentage points from February, and the Hispanic unemployment rate decreased 0.1 percentage points from February, but the unemployment rate for African-Americans increased 0.4 percentage points from February. The Household Survey showed an increase of 335,000 jobs in March, versus 180,000 in the establishment survey.
On Aug. 14, 2006, the average price for a gallon of regular gas was $3. At that point gasoline prices started to fall precipitously to $2.20 for the week of Nov. 6, the lowest price in a first round of reductions. Gasoline prices started to increase from that point. Prices increased slowly at first, but by the end of November, gasoline prices were up 4.6 cents. The week of Dec. 4, gasoline prices, at $2.297, were up 5.1 cents, more than all of November. Gasoline prices Feb. 5, 2007, at $2.191, were down 5.1 cents, or 6.5 percent, from a year earlier. From Feb. 5 to March 12, a five-week period, gasoline rose 36.8 cents, or 16.8 percent, to $2.559 per gallon. From March 12 to April 9, a four-week period, gasoline prices rose another 24.3 cents to $2.802 per gallon, or 9.5 percent. From Feb. 5 to April 9, gasoline prices rose 61.1 cents a gallon, or 27.9 percent. As of April 9, gasoline prices were up 4.4 percent compared with the same time a year earlier.
The record-setting level of $77.30 a barrel on the crude-oil futures markets on Aug. 7, 2006, due to the closure of part of the Prudhoe Bay oil field in Alaska operated by BP because of corrosion in the pipeline system, settled to a close on the futures market April 12, 2007, to $63.85 a barrel, a drop of 17.4 percent. The recent very cold winter has increased demand for heating oil. Crude-oil prices hit a 20-month low of $49.90 a barrel on January 18, 2007, and have since rebounded 28 percent to $63.85 a barrel April 12, 2007.
Experts expect the price of oil to return to an average price of $65 a barrel for all of 2007, as OPEC seems to have regained pricing power through reductions in OPEC output as global demand increases.
The silver lining in the recent decline in casual-dining comparable sales is that fundamental demand remains strong. When more disposable income becomes available to the under-$70,000 income group, they will come back to casual dining. Wages for hourly workers started showing real income gains starting in August 2006. More time is needed for households to be on a positive path before they change their budgets. If the current trends continue, it’s only a matter of time before more money is spent again in percentage increase terms on restaurant purchases.
The consumer emotional climate is still not good and has hurt casual-dining sales.
We are back to a series of negative disclosures on federal government and Bush administration actions, which go on week after week, contributing to the maintenance of a poor emotional climate.
The middle class can afford to have any one thing they want. The problem is they want everything. The current break point in household pretax income is $70,000. At that level and above, most households can maintain their everyday standard of living. When costs get high, they can change their spending on vacations as the safety valve to ensure continuity in everyday patterns of spending. Unfortunately, this group is only 26 percent of households.
Current brain scan research indicates that the majority of decisions are being more heavily influenced by emotion rather than by conscious, rational thought. This shows the vital need for concepts to have robust emotional engagement with their patrons.
At this moment, the majority of brands in casual dining need to do a much better job in their degree of emotional engagement with their customers.
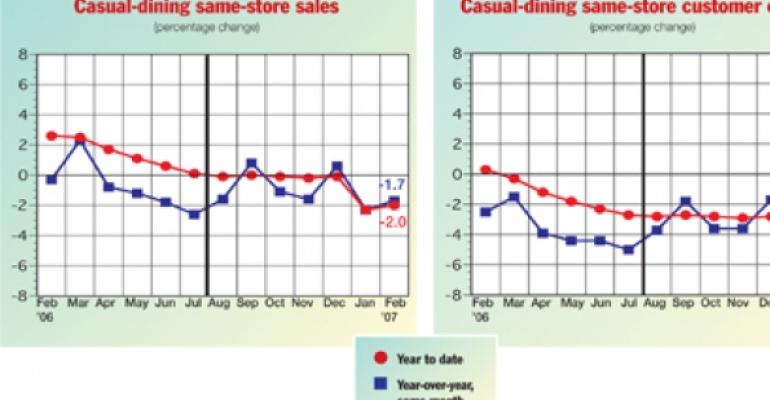
February 2007 final same-store sales were down by 1.7 percent. Those results were 1.4 percentage points worse than 0.3-percent decline during the below-trend month of February 2006, the fifth-best month of that year. February 2007 comparable-restaurant guest counts were down 4.1 percent. February 2006 comparable-restaurant guest counts were down 2.5 percent. Year-to-date comparable sales in February 2007 were down 2 percent, versus an increase of 2.6 percent for February 2006. Year-to-date comparable guest counts in February 2007 declined 4.5 percent, versus an increase of 0.3 percent for February 2006.
The casual sector’s year-to-date all-restaurant sales through February 2007 rose 3.7 percent, versus a 9.6-percent increase for February 2006. Year-to-date all-restaurant guest counts through February 2007 were up 1.4 percent, compared with an increase of 7.3 percent for February 2006.
The Consumer Confidence Index fell in March 2007 by 4 index points to 107.2. The March 2007 Index was down 0.3 index points from March 2006 levels. The Present Situation increased 0.5 index points to 137.6 index points, which is 4.3 index points above March 2006. The Expectations Index, measuring how people think the economy will perform in six months, for September 2007 fell by a substantial 6.9 index points to 86.9. That was a decrease of 3.4 index points from March 2006. Expectations in March 2006 were down 43 index points below Present Situation. By March 2007, Present Situation still exceeded Expectations by a whopping 50.7 index points.
Detailed March 2007 data show that consumer confidence was better in two regions, East South Central and Mountain, but unchanged in West South Central and down in six regions from February 2007 levels.
Six regions were above an index number of 100.0. The strongest region for Consumer Confidence in March 2007 was Mountain at 142.7 index points, followed by West South Central at 130.0, East South Central at 122.5, Pacific at 121.5, South Atlantic at 117.1, West North Central at 105.8, Middle Atlantic at 91.5, New England at 90.6, and East North Central at 65.5.
The unemployment rate in March 2007 was 4.4 percent, down 0.1 percentage points from February 2007. The unemployment rate had been between 4.5 percent and 5.5 percent in each month since July 2004. The March unemployment rate matches the May 2001 unemployment low. The total number of people working in nonfarm jobs was 137.6 million. There was an increase in March 2007 of 180,000 nonfarm jobs from February 2007. That was the 42nd straight month, starting in September 2003, that employment had risen. The initial jobs increase in February 2007 of 97,000 jobs was revised upward by 16,000 jobs to 113,000 jobs. Prior total employment in the 21st century peaked in February 2001 at 132,551,000 jobs.
Total nonfarm employment fell by 2.7 million jobs from February 2001 through August 2003. By March 2007, there was an increase of 4.9 million jobs, or 3.7 percent, from February 2001. We are up 7.6 million jobs, or 5.9 percent, from the recent jobs bottom of August 2003.
In March 2007, 1.2 million people had been unemployed for 27 weeks or more, 18.4 percent of the unemployment total. In March 2006 the percentage was 18.5 percent. That persistence in long-term unemployment was still a negative pressure on consumer confidence.
In March 2007, manufacturing jobs decreased by 16,000 jobs from February. In the past 12 months manufacturing employment has decreased by 109,000 jobs. In March 2007, construction industry employment was up 56,000 jobs from February and up 21,000, or 0.3 percent, from March 2006. Employment in the service-providing sector—which includes, among other sectors, retail trade, services and government—increased by 137,000 jobs. The service-providing sector is up 2,006,000 jobs, or 1.8 percent, in the past 12 months.
Seasonally adjusted hourly earnings were up 6 cents in March 2007 to $17.22. Seasonally adjusted hourly earnings rose 4.1 percent from March 2006. Seasonally adjusted average weekly earnings were up $3.75 in March 2007 to $583.76. Seasonally adjusted average weekly earnings rose 4.4 percent from March 2006.
Total private nonfarm weekly hours worked in March 2007, at 33.9 hours, are up 0.1 hours from February 2007. Manufacturing average weekly hours worked in March, at 41.1 hours, are up 0.2 hours from February 2007. Factory overtime, at 4.3 hours, is up 0.1 hours from February 2007.
In February, two of 11 Knapp-Track regions, Pacific Northwest and Texas, had positive comparable-restaurant sales. Nine regions had negative comparable-restaurant sales results. Eight regions had better comparable-sales results in February 2007 than in January 2007. One region, Mountain, was unchanged. Two regions, East North Central and Middle Atlantic, had worse comparable-sales results in February than in January.
The spread between the high and low regions for comparable restaurant sales in February 2007 was 7.8 percentage points, compared with the 5.3 percentage points of January 2007. The best performing region was Pacific Northwest, followed by Texas, Mountain, New England, East & part West South Central, California, South Atlantic, and Florida. Those eight regions had better or equal comparable-restaurant sales results than the national average of negative 1.7 percent in February. The worst performing region was East North Central, followed by West North Central and Middle Atlantic.
Year to date, the highest region for comparable-sales results was Pacific Northwest and the lowest region was West North Central. The spread between the two regions was 5.6 percentage points. The median-concept comparable-restaurant sales change was down 1.5 percent.
Red Lobster had the highest comparable-restaurants sales in February among concepts with sales in excess of $300 million a year.
With regard to comparable restaurants in February, the spread between comparable-restaurant sales and guest counts was down 2.4 percentage points. The national average for comparable-restaurant guest counts in February was down 4.1 percent. The best performing region was Pacific Northwest. The worst performing region was East North Central. All 11 regions had negative guest counts. The spread between the best and worst performing region was 7.2 percentage points.
All-restaurant sales in February were up 3.9 percent. Nine of 11 regions were positive. Two regions, West North Central and East North Central, were negative. The spread between all-restaurant and comparable-restaurant sales was 5.6 percentage points.
All-restaurant guest counts in February were up 1.6 percent. Nine regions were positive. Two regions were negative. The spread between all-restaurant and comparable-restaurant guest count gains was down 5.7 percentage points.
Year-to-date comparable-restaurant sales in February were down 2 percent. Year-to-date comparable-restaurant guest counts were down 4.5 percent.
Year-to-date all-restaurant sales in February were up 3.7 percent. Year-to-date all-restaurant guest counts were up 1.4 percent.
Malcolm M. Knapp is president of Malcolm M. Knapp Inc. Knapp-Track?™ is an exclusive report on the casual-theme and dinner-house segment, presented on a monthly basis. Based on actual, unpublished results received from key chains, Knapp-Track™ offers a realistic gauge of the segment’s performance. All percentage changes reflect nominal dollars.
The monthly same-store sales data are indicative of basic industry health, while the same-store customer traffic reflects the underlying strength of consumer demand.
Monthly all-store sales provide a benchmark against which the reported sales change of published quarterly reports can be measured; monthly all-store customer traffic is a proxy for real growth.
The year-to-date comparisons for all four categories provide perspective as the year unfolds, giving a fix on where the business is at any point in time.
Knapp-Track™ subscribers, representing more than $29.0 billion in sales, include Acapulco, Applebee’s, Benihana, Bennigan’s, Buca di Beppo, Chevys, Chili’s, Don Pablo’s, LongHorn Steakhouse, Lone Star Steakhouse & Saloon, The Olive Garden, On The Border, Outback Steak House, P.F. Chang’s, Pizzeria Uno, Red Lobster, Smokey Bones, Macaroni Grill, and T.G.I. Friday’s.