
The midweek Fourth of July holiday and the subprime mortgage crisis dealt a blow to guest traffic at casual dinnerhouses in July, but operators still were expected to post better results than they had the year earlier.
Estimated same-store sales for July were up 0.5 percent — only the second time those figures have been up in 2007 and a vast improvement from July 2006, when same-store sales made their biggest drop for the year, down 2.6 percent. Meanwhile, estimated comparable guest counts for July fell 2.4 percent, compared with comparable guest counts that fell 5 percent during the same month a year earlier.
While July data is only an estimate, three of four weeks appeared to have positive same-store sales results, and all four weeks appeared to have negative guest counts.
The spread between the best week of the four weeks in July and the worst week is 2.5 percentage points, with the second week seeing the best results.
The worst week was the first one because the Fourth of July holiday occurred on a Wednesday, causing many people to take off work on Thursday and Friday and pushing sales down 0.4 percent.
Concern over subprime and AltA mortgages, those given to people with no documentation of income, also had a negative impact on same-store sales. In California, home of a large concentration of underperforming subprime mortgages, same-store sales were 3 percentage points below the U.S. average in July, compared with same-store sales that were 0.2 percentage points above the national average in June. Excluding California’s results, same-store sales nationwide would have been up 1.6 percent.
Subprime mortgages comprised about 20 percent of all mortgages made in 2006, and Alt-A mortgages comprised about 13 percent. Unfortunately, the peak in mortgage resets has not yet occurred. The peak is expected in October, when $50 billion in mortgages will be reset. The volume of resetting mortgages is projected to be slightly above $30 billion each month thereafter until September 2008.
July’s 0.5-percent increase in estimated same-store sales was below the weighted average same-store sales increase of 2.8 percent for the retail industry, a figure measured by Bear Stearns retail analysts. From April 2003 through July, retail same-store sales results out-performed those of casual dining much of the time, except in November 2004, January 2005, April 2005, May 2005, January 2006, March 2006 and this past April.
Value propositions will continue to be very important for most casual-dining concepts as inflation and increases in energy, education, and medical and drug costs put substantial pressure on households earning less than $50,000.
The third and final estimate for real gross domestic product, or GDP, growth for the first quarter was just 0.7 percent, the slowest rate since the fourth quarter of 2002.
However, the first estimate for second-quarter real GDP growth is a much stronger 3.4 percent.
Both the Manufacturing Index and the Non-Manufacturing Index fell in July. The Manufacturing Index for the month, as measured by the Institute for Supply Management, was 53.8, down 2.2 index points from 56.0 in June. An index above 50.0 indicates an expansion of manufacturing activity. The average Manufacturing Index for the past 12 months is 52.7. The good news for manufacturers is that export orders were still expanding in July, when the index reached 56.5, up 0.5 index points from June. Export orders have expanded for the past 56 months.
The Non-Manufacturing Index, also from the Institute for Supply Management, fell 4.9 index points to 55.8 in July, from 60.7 in June. The average Non-Manufacturing Index for the past 12 months is 56.8.
From July 2006 through July 2007, the number of payroll jobs has increased 1.37 percent, to 1.87 million jobs.
Meanwhile, the unemployment rate in July for whites was 4.2 percent, while the rate for Hispanics or Latinos was 5.9 percent and the rate for blacks was 8 percent. The unemployment rates for both whites and Hispanics rose 0.2 percentage points from June, while the unemployment rate for blacks declined 0.5 percentage points. The Household Survey showed a decrease of 30,000 jobs in July, versus a gain of 92,000 jobs in the establishment survey.
From Jan. 29, when gas hit its lowest point so far in 2007 at $2.165 per gallon, to Aug. 8, gas prices are up 67.3 cents a gallon, or nearly 31.1 percent, but still 20 cents lower than year-ago prices. Gas prices hit an all-time high May 21, when they reached $3.218 per gallon. By July 9, prices had fallen 38 cents per gallon. The Energy Information Agency estimates that the average cost for a gallon of regular gasoline will be $2.95 this summer, compared with $2.84 last year.
For casual-dining operators, the silver lining is that fundamental demand for their services remains strong, and when those households making less than $70,000 per year have more disposable income, they will return.
But although wages for hourly workers started showing real gains in August 2006, these workers have not yet changed their spending habits. By spending less on durable goods such as cars and flat-screen TVs, however, consumers in time should have more money to spend on eating out.
For now, however, consumer sentiment remains negative, despite a reasonably strong economy and relatively low unemployment. A Wall Street Journal/NBC News poll in late July found that only 19 percent of respondents think the United States is going in the right direction, while 67 percent said they believe the country is on the wrong track. More than two-thirds of respondents said they believe the U.S. economy is now in recession or will be in the next year.
Also, for the first time since Sept. 11, 2001, most of the respondents said they believe the country is less safe from terrorists than before the attack. Forty-four percent of respondents said health care is a concern, while 34 percent said they worried about jobs going overseas, and 22 percent said they were concerned about the growing gap between rich and poor.
Higher inflation rates for food purchased in grocery stores than in restaurants could help the industry. Throughout 2007, the rate of inflation for restaurant meals has steadily fallen compared with that of grocery food, as reflected in the Consumer Price Index.
In January, inflation for restaurant meals was 1.651 percentage points higher than that for grocery food. In February, the difference had narrowed to 0.498 percentage points higher. In March, inflation for restaurant meals was 0.082 percentage points lower than that for grocery food. In April, that figure was 0.531percentage points lower than grocery food. In May, restaurant meals were 1.107 percentage points lower than grocery food, and in June, the inflation rate for restaurant meals was 1.199 percentage points lower than grocery food.
Given the increase in wholesale food prices, this trend could continue for months. Consumer awareness that the cost of food has substantially increased should help operators raise their prices.
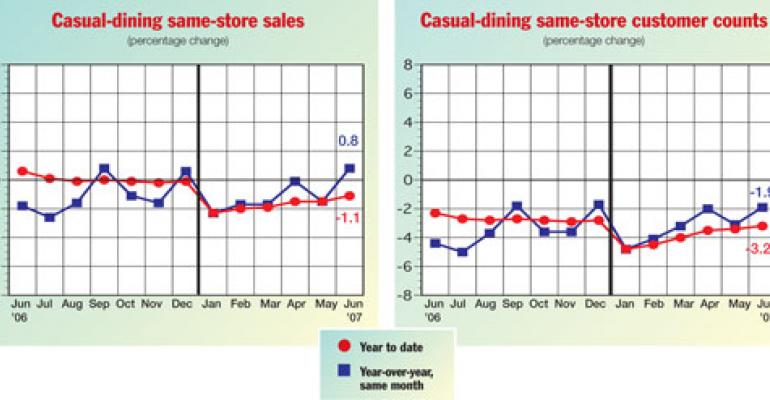
Final comparable-restaurant sales in June were up 0.8 percent, 2.6 percentage points better than in June 2006, when same-store sales fell 1.8 percent, marking the worst month of the year. Same-restaurant guest counts for June were down 1.9 percent, compared with guest counts down 4.4 percent in June 2006.
Year-to-date comparable guest counts in June were down 3.2 percent, versus a drop of 2.3 percent for June 2006. Year-to-date all-store sales through June were up 4.7 percent. In June 2006, that figure was up 7 percent. Year-to-date all-store guest counts through June grew 2.7 percent, compared to 4.2 percent in June 2006.
Comparable-store sales dipped 0.2 percent for the second quarter of 2007, compared with a decrease of 1.3 percent for the second quarter of 2006, which was the year’s worst quarter. Guest counts fell 2.3 percent for the second quarter of 2007, compared with a decrease of 4.2 percent for the second quarter of 2006.
The Consumer Confidence Index rose in July by 7.3 index points to 112.6, the highest number since August 2001 when it reached 144.5. The July index is 5.6 points above that in July 2006. The Present Situation increased a sharp 9.3 index points to 139.2, which is 5 points higher than July 2006. The Expectations Index, which reflects how people think the economy will perform in January 2008, rose by a more modest 6 index points to 94.8, 5.9 points higher than in July 2006.
Detailed data for July show that consumer confidence was higher in eight regions and worse in one region, the Pacific, compared with June levels. Eight regions were above an index number of 100.0. The Mountain region posted the highest consumer confidence in July at 138.0 index points, followed by West South Central at 131.1, South Atlantic at 122.3, East South Central at 115.6, Pacific at 111.5, New England at 109.8, West North Central at 106.2, Middle Atlantic at 100.1, and East North Central at 76.8.
The unemployment rate In July was 4.6 percent, up 0.1 of a percentage point from June. The unemployment rate has been between 4.5 percent and 5.5 percent each month since July 2004 with the exception of March, when it was 4.4 percent, matching a low registered in May 2001.
The total number of people working nonfarm jobs in July was 138,122,000, up 92,000 nonfarm jobs from June, marking the 46th month since September 2003 that employment has risen.
The initial jobs increase of 132,000 jobs in June was revised down to 126,000 jobs. Prior total employment peaked in February 2001 at 132,551,000 jobs. Total nonfarm employment fell 2,733,000 jobs from February 2001 through August 2003. By July 2007, there was an increase of 5,571,000 jobs from February 2001. We are up 8,304,000 jobs, or nearly 6.4 percent, from a bottom reached in August 2003. The number of jobs increased by 955,000 in the first six months of 2007.
In July, 1,308,000 people had been unemployed for 27 weeks or more, 18.4 percent of the unemployment total, compared with 18.3 percent a year ago. Such persistent long-term unemployment still hurts consumer confidence.
The number of jobs in the service-providing sector, which includes retail, services and government, rose by 104,000. The service-providing sector has gained 2,065,000 jobs in the past 12 months. Employment in food services and drinking places increased by 22,200 jobs in July. In the past 12 months, food services and drinking places employment has gained 365,400 jobs, up 3.89 percent.
Seasonally adjusted hourly earnings were up 6 cents in July to $17.45. Seasonally adjusted hourly earnings rose 3.93 percent from July 2006. Seasonally adjusted average weekly earnings were up 29 cents in July to $589.81. Seasonally adjusted average weekly earnings rose 3.62 percent from July 2006.
In June, nine of 11 Knapp-Track regions had positive same-store sales gains. Two regions, Florida and New England, had negative comparable-restaurant sales results.
All regions had better same-store sales results in June than in May. The spread between the high and low regions in June was 6.3 percentage points, versus 4.7 percentage points in May.
The best-performing region was the Pacific Northwest, followed by Texas, West North Central, Middle Atlantic, and Mountain and California, which were tied. These six regions had better or equal comparable-restaurant sales results than the national average of 0.8 percent in June. The worst-performing region was Florida, followed by New England, East and part West South Central, East North Central and finally South Atlantic.
Year to date, the Pacific Northwest has posted the highest comparable-store sales results and Florida has posted the lowest. The year-to-date spread between the two regions was 4.1 percentage points. The median-concept same-store sales change was 1 percent.
The national average for same-restaurant guest counts in June was down1.9 percent. The best-performing region was the Pacific Northwest. The worst-performing region was Florida. Nine of 11 regions had negative guest counts. Two regions, Pacific Northwest and Texas, had positive guest count changes. The spread between the best and worst regions was 5.6 percentage points.
Sales for all restaurants were up 6.4 percent in June, with all 11 regions posting positive gains. The spread between all restaurants and comparable-restaurant sales was 5.6 percentage points.
Guest counts for all restaurants were up 3.8 percent in June, with all regions again posting positive gains. The spread between all restaurants and comparable-restaurant guest count gains was 5.7 percentage points.
Year-to-date same-store sales in June were down 1.1 percent. Year-to-date same-restaurant guest counts were down 3.2 percent.
Year-to-date sales for all restaurants in June were up 4.7 percent. Year-to-date guest counts for all restaurants were up 2.7 percent.
Malcolm M. Knapp is president of Malcolm M. Knapp Inc. Knapp-Track™ is an exclusive report on the casual-theme and dinner-house segment, presented on a monthly basis. Based on actual, unpublished results received from key chains, Knapp-Track™ offers a realistic gauge of the segment’s performance. All percentage changes reflect nominal dollars. The monthly same-store sales data are indicative of basic industry health, while the same-store customer traffic reflects the underlying strength of consumer demand. Monthly all-store sales provide a benchmark against which the reported sales change of published quarterly reports can be measured; monthly all-store customer traffic is a proxy for real growth. The year-to-date comparisons for all four categories provide perspective as the year unfolds, giving a fix on where the business is at any point in time. Knapp-Track™ subscribers, representing more than $29.0 billion in sales, include Acapulco, Applebee’s, Benihana, Bennigan’s, Buca di Beppo, Chevys, Chili’s, Don Pablo’s, LongHorn Steakhouse, Lone Star Steakhouse & Saloon, The Olive Garden, On The Border, Outback Steak House, P.F. Chang’s, Pizzeria Uno, Red Lobster, Smokey Bones, Macaroni Grill, and T.G.I. Friday’s.